The debugger Expo developers actually want.
Inspect every network request and console log from your Expo or React Native app, in real time. No IPs to hardcode, no Wi-Fi tears — just open the desktop app and run your project.
Works with Expo SDK 49+, dev clients, simulators and physical devices.
- Expo SDK 49+
- React Native
- fetch
- axios
- GraphQL
- Redux
- Zustand
- TypeScript
- iOS
- Android
- Dev clients
- Simulators
- Physical devices
- mDNS auto-discovery
Everything you need to see what your app is doing
Built like Flipper. Sized like a small CLI. Free and open source.
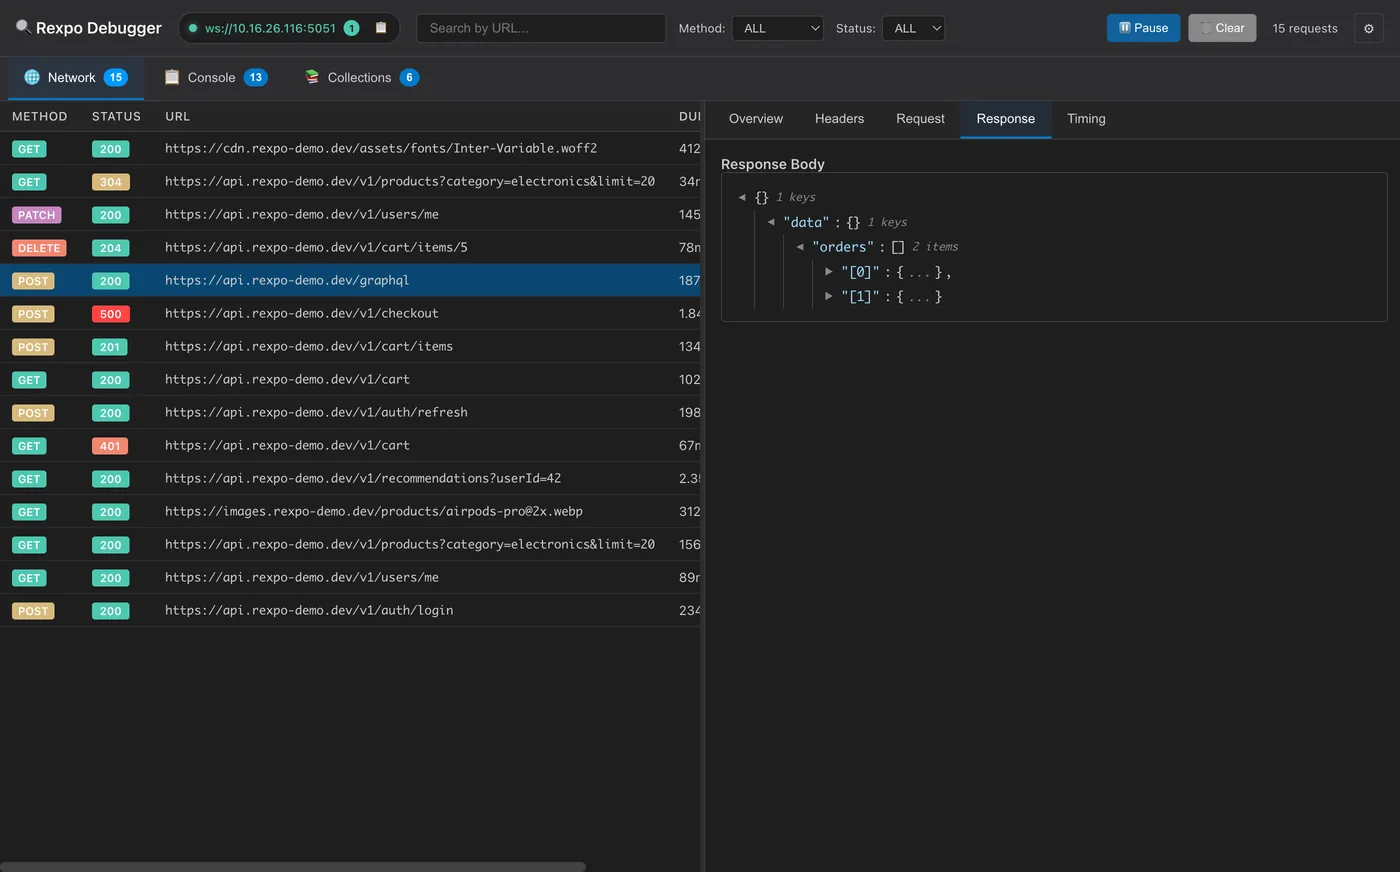
Real-time network
Capture every fetch and axios call as it happens. Headers, body, timing, status — all of it.
Console with stack traces
console.log / warn / error / info / debug streamed live, with automatic stack traces for the noisy ones.
Zero-config auto-discovery
Desktop publishes itself over mDNS, agent finds it. No IPs in your code. Survives Wi-Fi changes.
Edit & Replay
Right-click any request to tweak method, URL, headers, body — then re-send. Postman in your debugger.
Collections
Save useful requests, group them by project, replay later. Persists across restarts.
State Inspector
Stream Redux, Zustand or any store to a live, searchable state tree and watch it change in real time.
Production safe
The Expo config plugin strips permissions and runtime code from release builds. Your store binary sees nothing.
Take the tour
Click through to see Rexpo Debugger in real use.
Every fetch and axios call streamed live. Headers, timing, status — and a JSON viewer that actually formats responses you can read.
Three steps. That's it.
- 1
Install the agent
Add the npm package and the mDNS native module to your Expo project.
- 2
Add the config plugin
Drop "rexpo-debugger" into expo.plugins and rebuild your dev client.
- 3
Open the desktop app
It auto-publishes itself. Run your app and watch traffic flow in within seconds.
npm install --save-dev rexpo-debugger
npx expo install react-native-zeroconf
Stop printf-debugging your network layer.
Free, MIT-licensed, no telemetry, no account. Just download and go.
github.com/omeremreelmali/rexpo-debugger/releases/latest