Features
A complete tour of what Rexpo Debugger gives you out of the box.
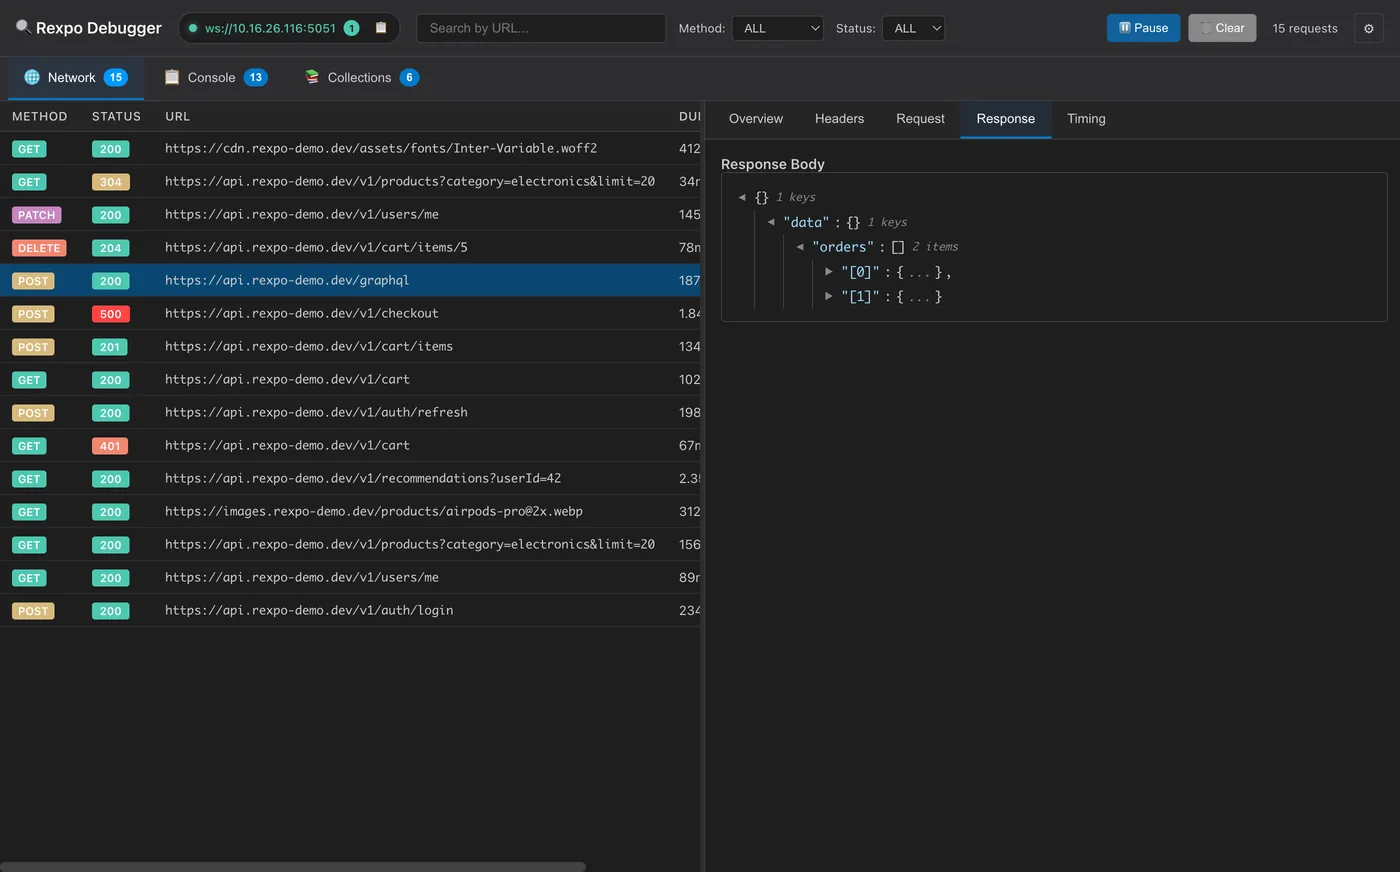
Network monitoring
- Real-time capture of all fetch and axios calls
- Method, status, URL, timing and size visible at a glance
- Full request and response headers
- Pretty-printed JSON for request and response bodies
- Filtering by method, status code and URL substring
- Pause capture without losing connection
- Color-coded status badges (2xx green, 3xx yellow, 4xx orange, 5xx red)
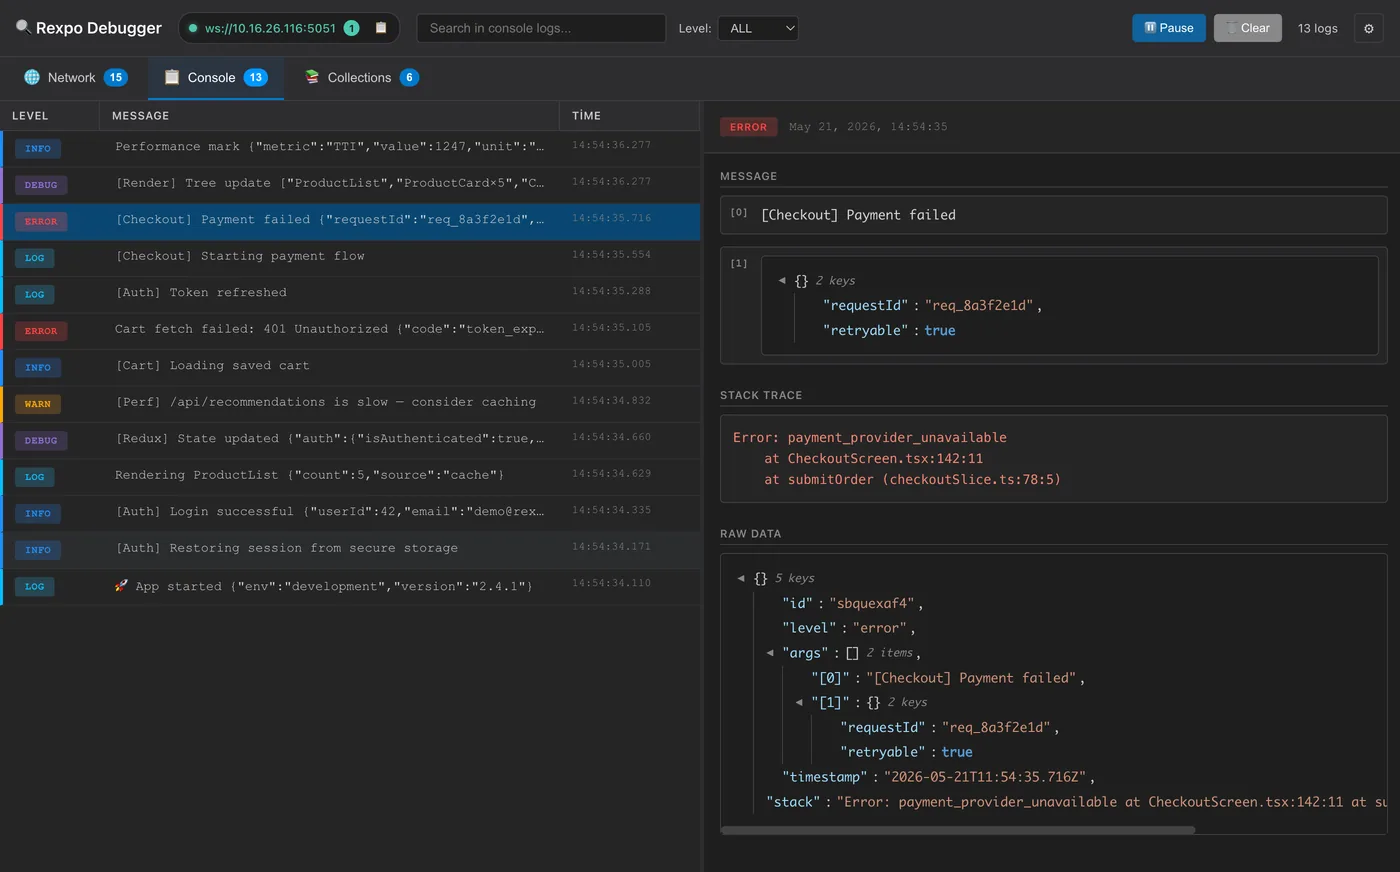
Console monitoring
- Captures console.log, info, warn, error and debug
- Color-coded levels for fast scanning
- Automatic stack traces for errors and warnings
- Rich formatting for objects, arrays, errors, dates and more
- Search by message content
- Filter by level
- One-click clean copy of any log — message, stack trace or raw JSON — as plain text, with no DOM selection artifacts
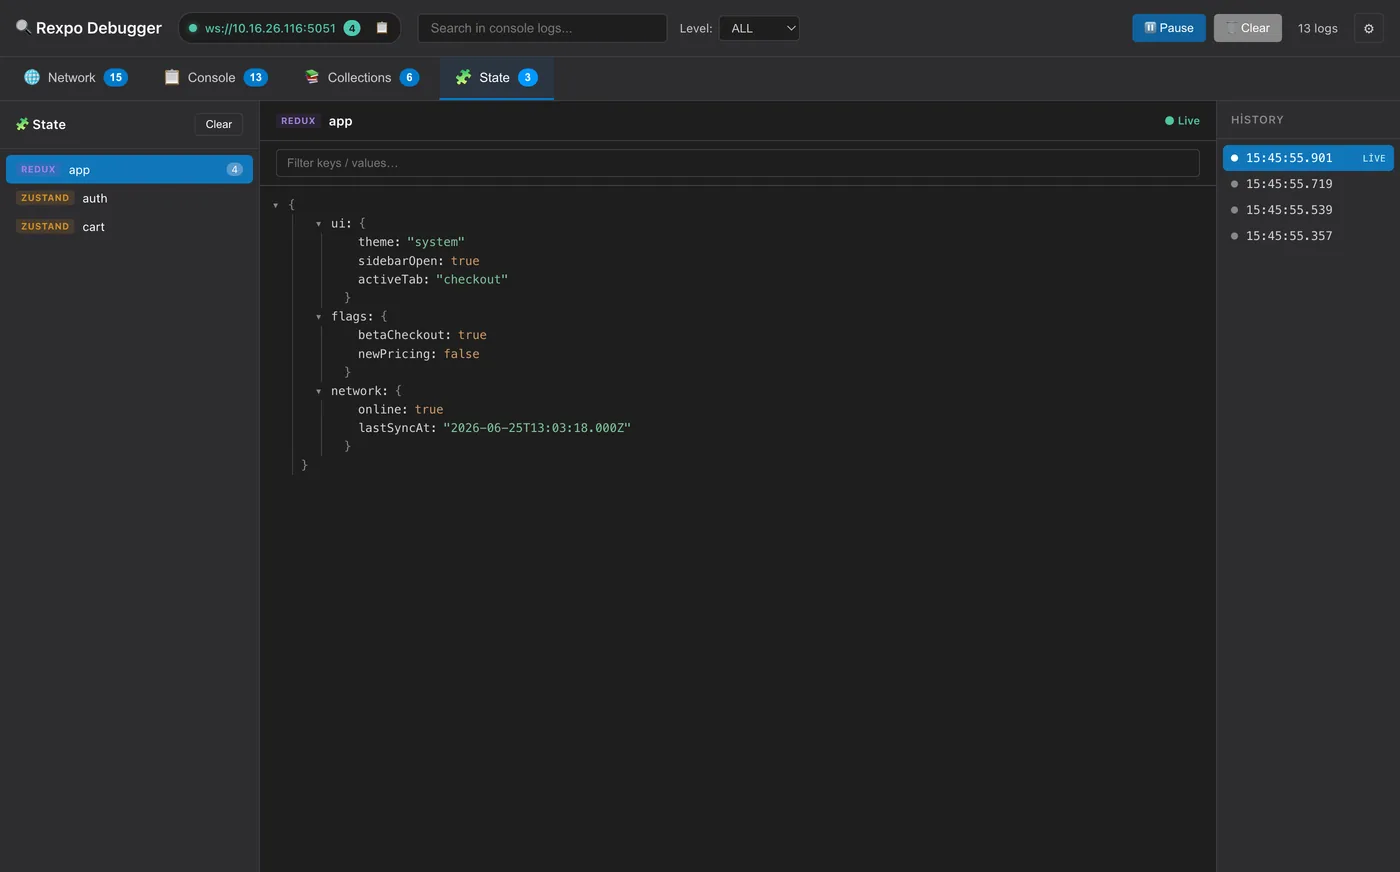
State inspection
- Live view of Redux, Zustand and any custom store in a dedicated State tab
- Searchable, collapsible JSON tree of each store's current value
- Timestamped snapshot history per store — scrub back through past values like a commit log
- Generic attachStore({ getState, subscribe }) adapter — Valtio, MobX, Jotai, XState, Effector and more
- Ready-made attachReduxStore / attachZustandStore helpers
- Safe serialization of functions, Maps/Sets, Dates and circular references
- Throttled real-time updates as your state changes (view-only today; write-back on the roadmap)
Zero-config auto-discovery
- Desktop publishes itself over mDNS / Bonjour as _rexpo._tcp
- Agent discovers the desktop automatically — no IPs in your code
- Survives Wi-Fi changes, machine IP changes and laptop reboots
- Expo config plugin injects iOS / Android permissions automatically
- Production-safe: permissions stripped from release builds
- Live connection chip in the desktop header with copy button
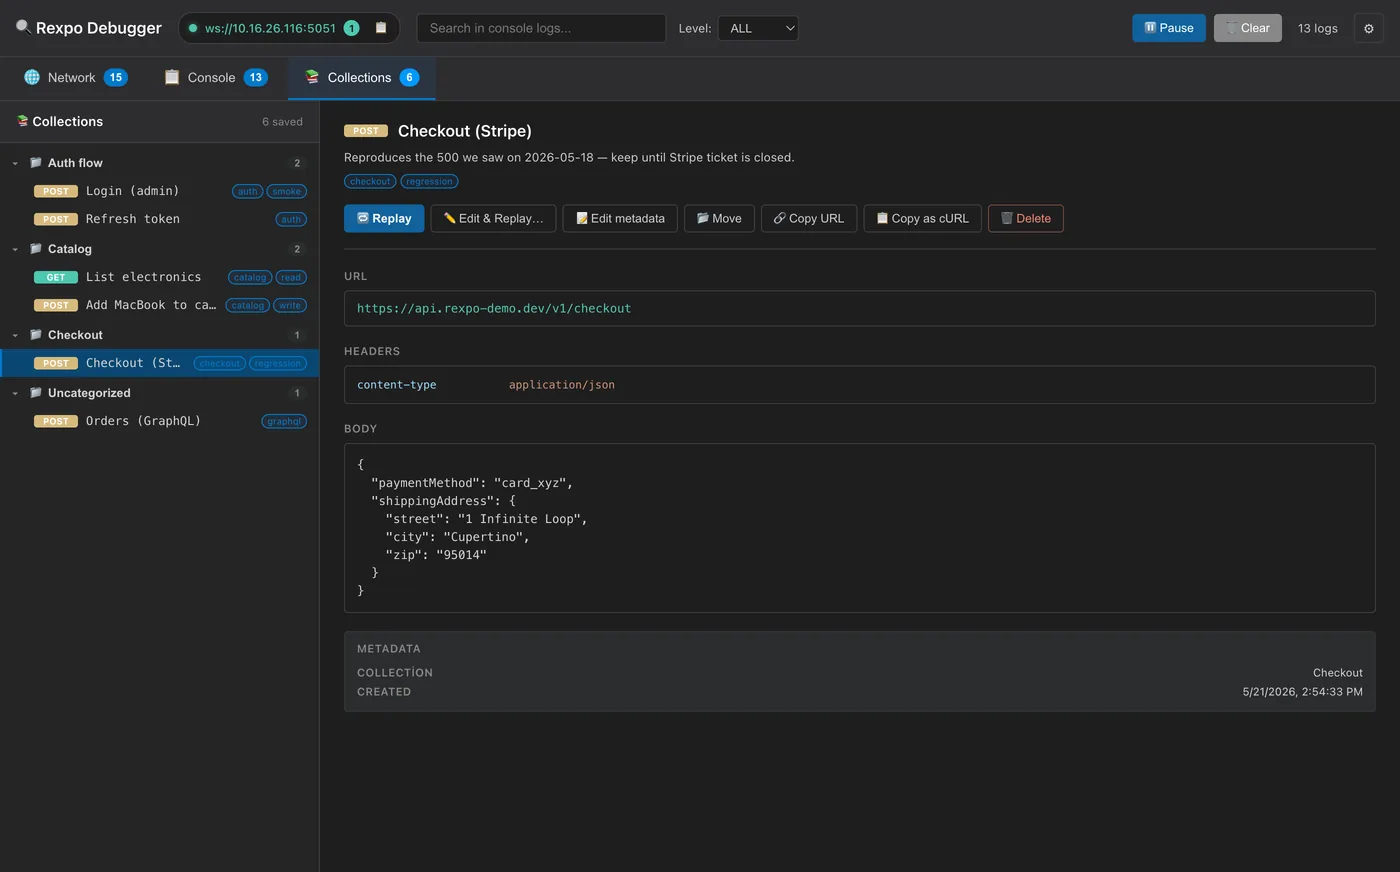
Collections — saved requests
- Save any captured request for later replay
- Optional name, collection, tags and description
- One-click Replay or Edit & Replay…
- Right-click menu: rename, move, delete
- Persisted in localStorage across restarts
- First-class collections that persist even when empty — create, rename or delete them
- Drag & drop saved requests between collections
- Import a request straight from a cURL command
- Save changes (overwrite) or Save as new when editing a saved request
Power-user network workflow
- Right-click any request to copy URL, cURL or JSON
- Edit & Replay: tweak method, URL, query params, headers, body
- Sensitive header masking when editing
- Save response body to file
- Delete individual requests without clearing all
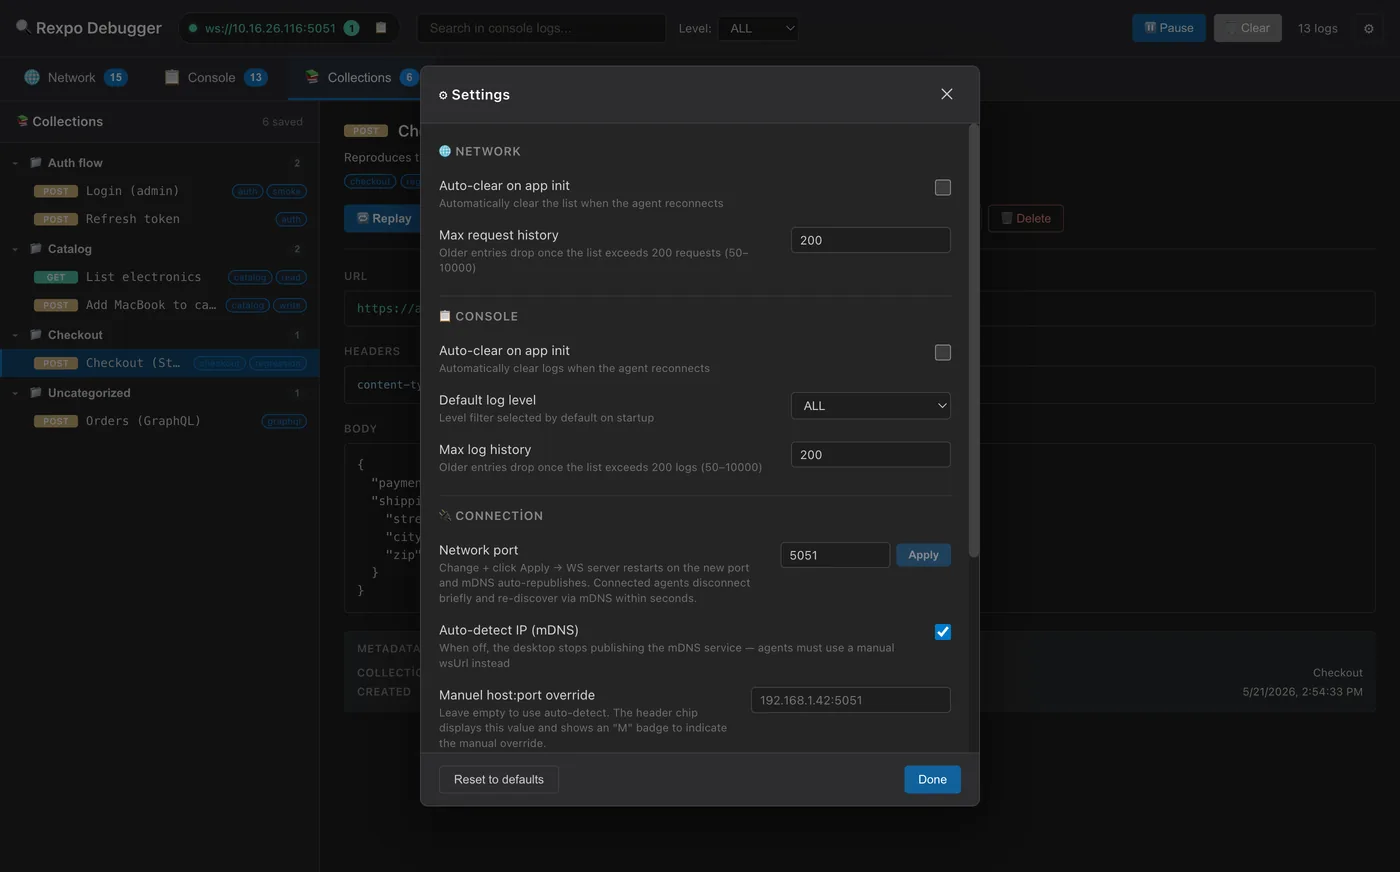
Settings & UX
- Settings modal with localStorage persistence
- Max history limits with live FIFO trimming
- Default log level
- Manual host:port override for networks that block mDNS
- Auto-clear panels on agent reconnect (toggleable)
- Independent Network / Console agent toggles
- Dark / Light / System theme
- Auto-reconnect with exponential backoff